
The current climate for film exhibition is uncertain, with pandemics and digital platforms all presenting potential for major changes in the way people watch film. To explore this, we looked at the Beyond Multiplex wave 1 survey data (conducted in four English region outside London, between October 2018 and January 2019) to examine which types of screen people use to watch films. Also, who it is that watches films on each type of screen. Overall, we found that although people watch films across several screens (usually four different types), age features in the number and types of screen the watch more than any other aspect. However, even age has only a limited impact – in general people are diverse in the screens they use across various socio-demographic measures. In short, we argue that audience research could look at new ways of identifying patterns amongst people’s engagement with different screens rather than focussing on demographically defined groups.
To explore how many screens people typically use in their day-to-day lives to watch films, we created a ‘cross-screen score’. For this, we combined responses to survey questions about how often people have watched films on various screen types and venues. This provided is us with 11 different ‘screen’s for watching film (TV; DVD/Blu-Ray; Stream/On-demand (paid);Stream/Torrent/On-demand (other), Multiplex cinema; Boutique cinema; Independent cinema; Film festival; Art gallery or medium; Community cinema or film club; while travelling, e.g. on an aeroplane in-flight entertainment system). This let us focus on how many media were involved, and how ‘cross-screen’ people are, e.g. how likely they are to watch films on two or more media (see figure 1). A cross-screen score of 1 relates to people who only watched films on one type; and scree-score of 11 indicates that they used all 11 screen types. We refer to these as ‘screens’ because the terms cover both the different media that people use and the different environments that they are based in (e.g. cinema, on an aeroplane).
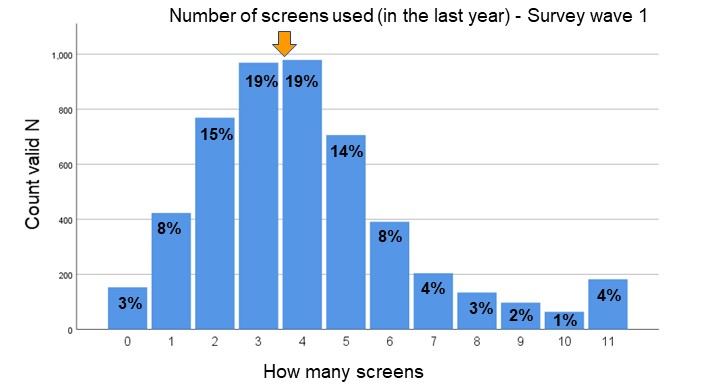
Overall, we found a relatively smooth distribution; most viewers had watched films on either 3 or 4 media (both at 19%), with numbers diminishing successively for people who had watched on either more or fewer. In short, people tend to watch films over a narrow range of different screens – which shows that people are not really all that diverse in the way they watch films.
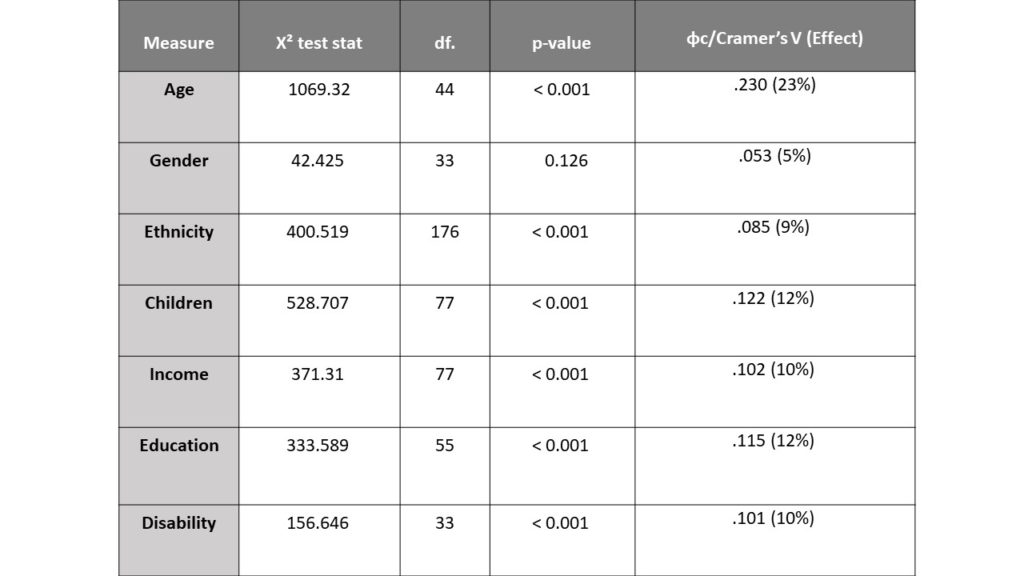
To see how each cross-screen score (1 to 11) breaks down in socio-demographic terms, we carried out a set of chi (Χ2) tests for independence (see Figure 2). This allowed to us to assess how significant relationships were between the cross-screen scores and each of the socio-demographic measures in our survey (see the Measures column). For any of those relationships to be seen as important, they needed to return a probability value of less than 0.05 (see p-value column). This indicates that we could be 99.55% sure that some type of relationship existed. As the table in figure 2 shows, other than gender, all socio-demographic measures are related in some way to screen-scores. However, the Χ2 did not tell us anything about the strength of those relationships. For that we used a set of Cramer’s V tests (see Cramer’s V (Effect) column). The Cramer’s V value (φc) can loosely be taken as a percentage of how strong the effect is (as indicated in the bracketed figure). The strongest φc value by far was age. With a Cramer’s V value .230, the relationship between age and cross-screen score is almost twice as strong as any other socio-demographic measure. Here, 0% would mean it has no effect and 100% would mean it completely determines their cross-screen score – so at 23% age is relatively important, but not necessarily a strong influence on the number of screens people use to watch film.
At this point, the survey data showed us that:
- People tend to watch films on three or four types of screen
- Most socio-demographics measures have some effect on how cross-screen people are, but it is not overly strong.
- Age has the strongest effect on cross-screen score compared with other socio-demographics factors
However, clumping all the survey respondents together in aggregated averages rather than looking at their diversity tends to flatten any in-depth understanding. For example - although the Χ2 and Cramer’s V tests show that age has the greatest effect on how many media people use to watch films, it did not tell us how different age groups relate to each screen. This left us unsure whether younger people watch on more media than older people, or if people in the middle (neither young nor old) watch on a particular screen more than others.
To address this, we looked at the cross-screen scores for different age groups in the survey data (see Figure 3) and found that people aged 18-24 and 25-34 are slightly more diverse in the number of media they use (averaging 4 or 5 media) than people age 55 or over (who average 2 media). However, there are quite a few 18-24-year-olds with low cross-screen scores and older people with high scree-scores, suggesting that the pattern is quite nuanced.
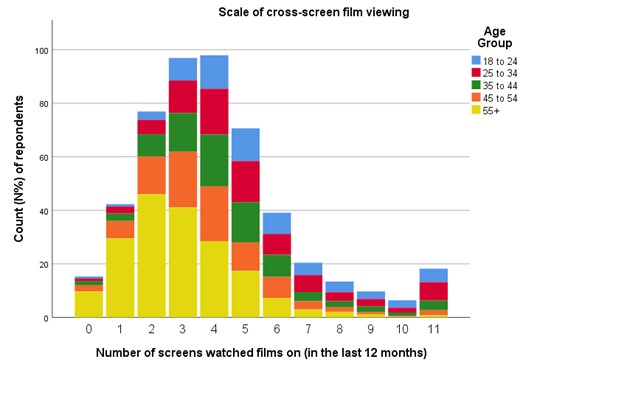
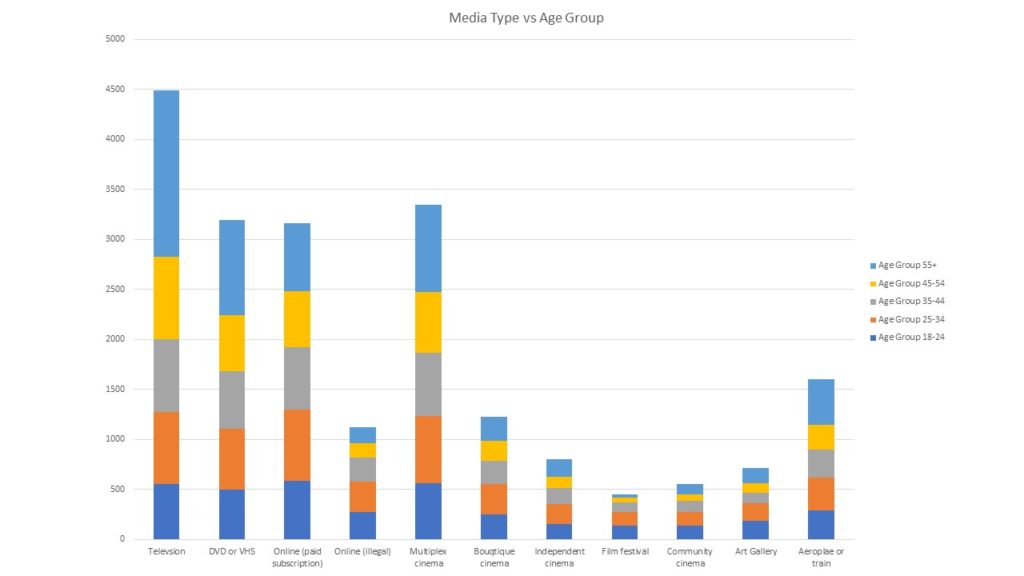
Overall, what figure 3 showed us was that people of all ages watch films across a broad array of media. Older people tend to watch across slightly fewer screens than young people, and a range of 2 to 5 media types is typical across all age groups (with 3 or 4 as the most common overall). While this fits with the screen-scores and φc values in figures 1 and 2, it does not fully address how age relates to the number of different screens people use to watch films in their day-to-day lives. So, we moved from counting how many screens people use, to look at the which screens are used by which age groups (see Figure 4). Here, each cell in the table shows the number of respondents (Valid N) from a total survey population of 5071, within each age group (listed as columns) that had watched a film at least once in the last year using each screen type (listed as rows).
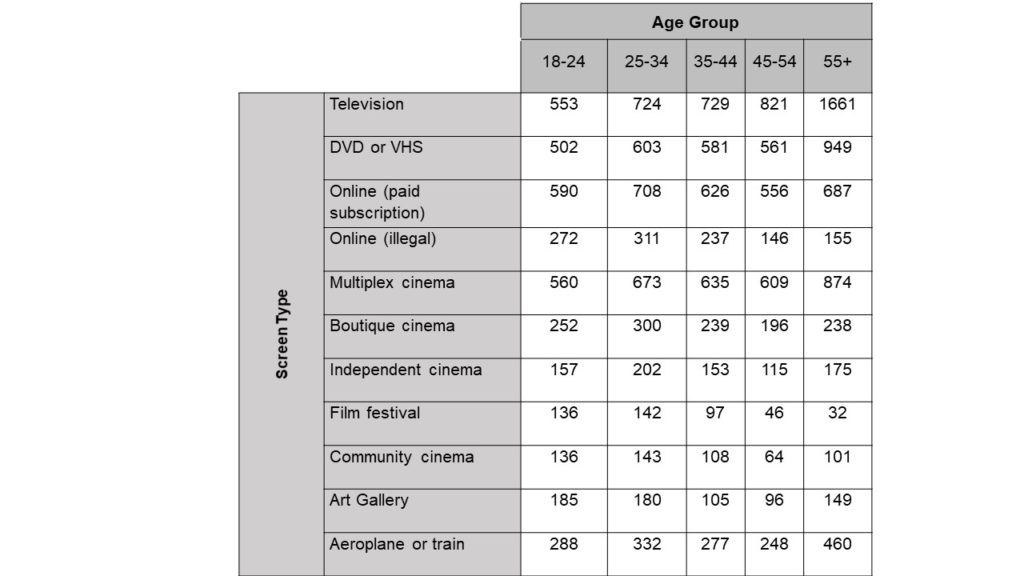
We found that although watching films broadcast on television is the most popular type of screen in everyday life, multiplex cinema, DVD/VHS, and paid online subscriptions are not that far behind (the four main types of screen in figure 1). However, that is not to say that other screens are any less important.
Breaking the use of each screen down by age in this way, showed us that people aged 55+ are over 10 times more likely to watch films broadcast on television than by illegally streaming pirated films - although 3% of that age group do stream them illegally. Similarly, although people aged 18-24 watch films online through a paid video-on-demand subscription more often than by any other means, it is only by a slim margin, e.g. 0.73% more than films broadcast on television and 0.05% more than going to watch at a multiplex cinema. However, people aged 18-25 are 4.25 times more likely to have attended a film festival in the last year than people aged over 55. Meanwhile, people aged 55 or over are 1.5 times more likely to have watched a film at a multiplex cinema than any other age group. Whilst these are interesting as a set of disparities between different age groups in the screens they use to watch film, overall our analysis shows that the range of screens that people use to watch films (in the four English regions of our study) appears to be quite diverse across all age groups. To that end, we argue that audience research based on socio-demographics could be usefully extended by focussing on how and why people find each screen type meaningful.
Overall, by exploring our survey data we find that people work across media and tend to watch films on broadcast on television, on DVD/VHS, through paid online subscriptions, or by going to multiplex cinemas more than any other media. Breaking this down into socio-demographics, we find that although different measures have some effect, age is by far the most significant – although its effect size of 23% means that it has only a limited impact. What this shows is that there is a broad diversity in the way people of all ages, and across various socio-demographics watch film. This, we feel, warrants further research. Notably, our exploration above does not cover frequency – how often each age group watches film on each media. For that we are planning a series of heat maps as one of our data visualisations tools due to be released soon. For now, our analysis suggests that rather than following convention to look film audiences as socio-demographically discrete entities that engage with specific media, it might be useful for audience researchers to also look at new ways of identifying patterns amongst people’s engagement with different screens.